Podcast media kit: the stats sponsors actually want to see

Nathaniel DeSantis
Sponsorship & Monetization

Introduction
A podcast media kit is your show’s résumé for advertisers, and the stats section is the part sponsors actually read. Get those numbers right and the rest of the kit is just nice formatting.
The problem is that most media kits bury the one number buyers care about under a pile of vanity metrics: total all-time downloads, social follower counts, “monthly impressions” of mysterious origin. Buyers have seen every trick, and padding reads as exactly what it is.
Here is what to include, what to cut, and how to present numbers so a media buyer trusts them on the first read.
Key takeaway
Lead with average downloads per episode within 30 days — it’s the number sponsors buy against
Show consistency across recent episodes, not one viral outlier
Geography and platform mix build trust and help sponsors qualify fit
Cut vanity metrics: all-time totals and follower counts read as padding
Say where your numbers come from; a verifiable source beats a bigger claim
The anatomy of a media kit
Before the numbers, a quick map. A working media kit typically has six parts, and it fits on one or two pages.
Show description and who it’s for
Audience stats (the section this post is about)
Listener geography
Ad formats and pricing
Past sponsors or notable episodes, if you have them
Contact details and how to book
The headline stat: 30-day downloads per episode
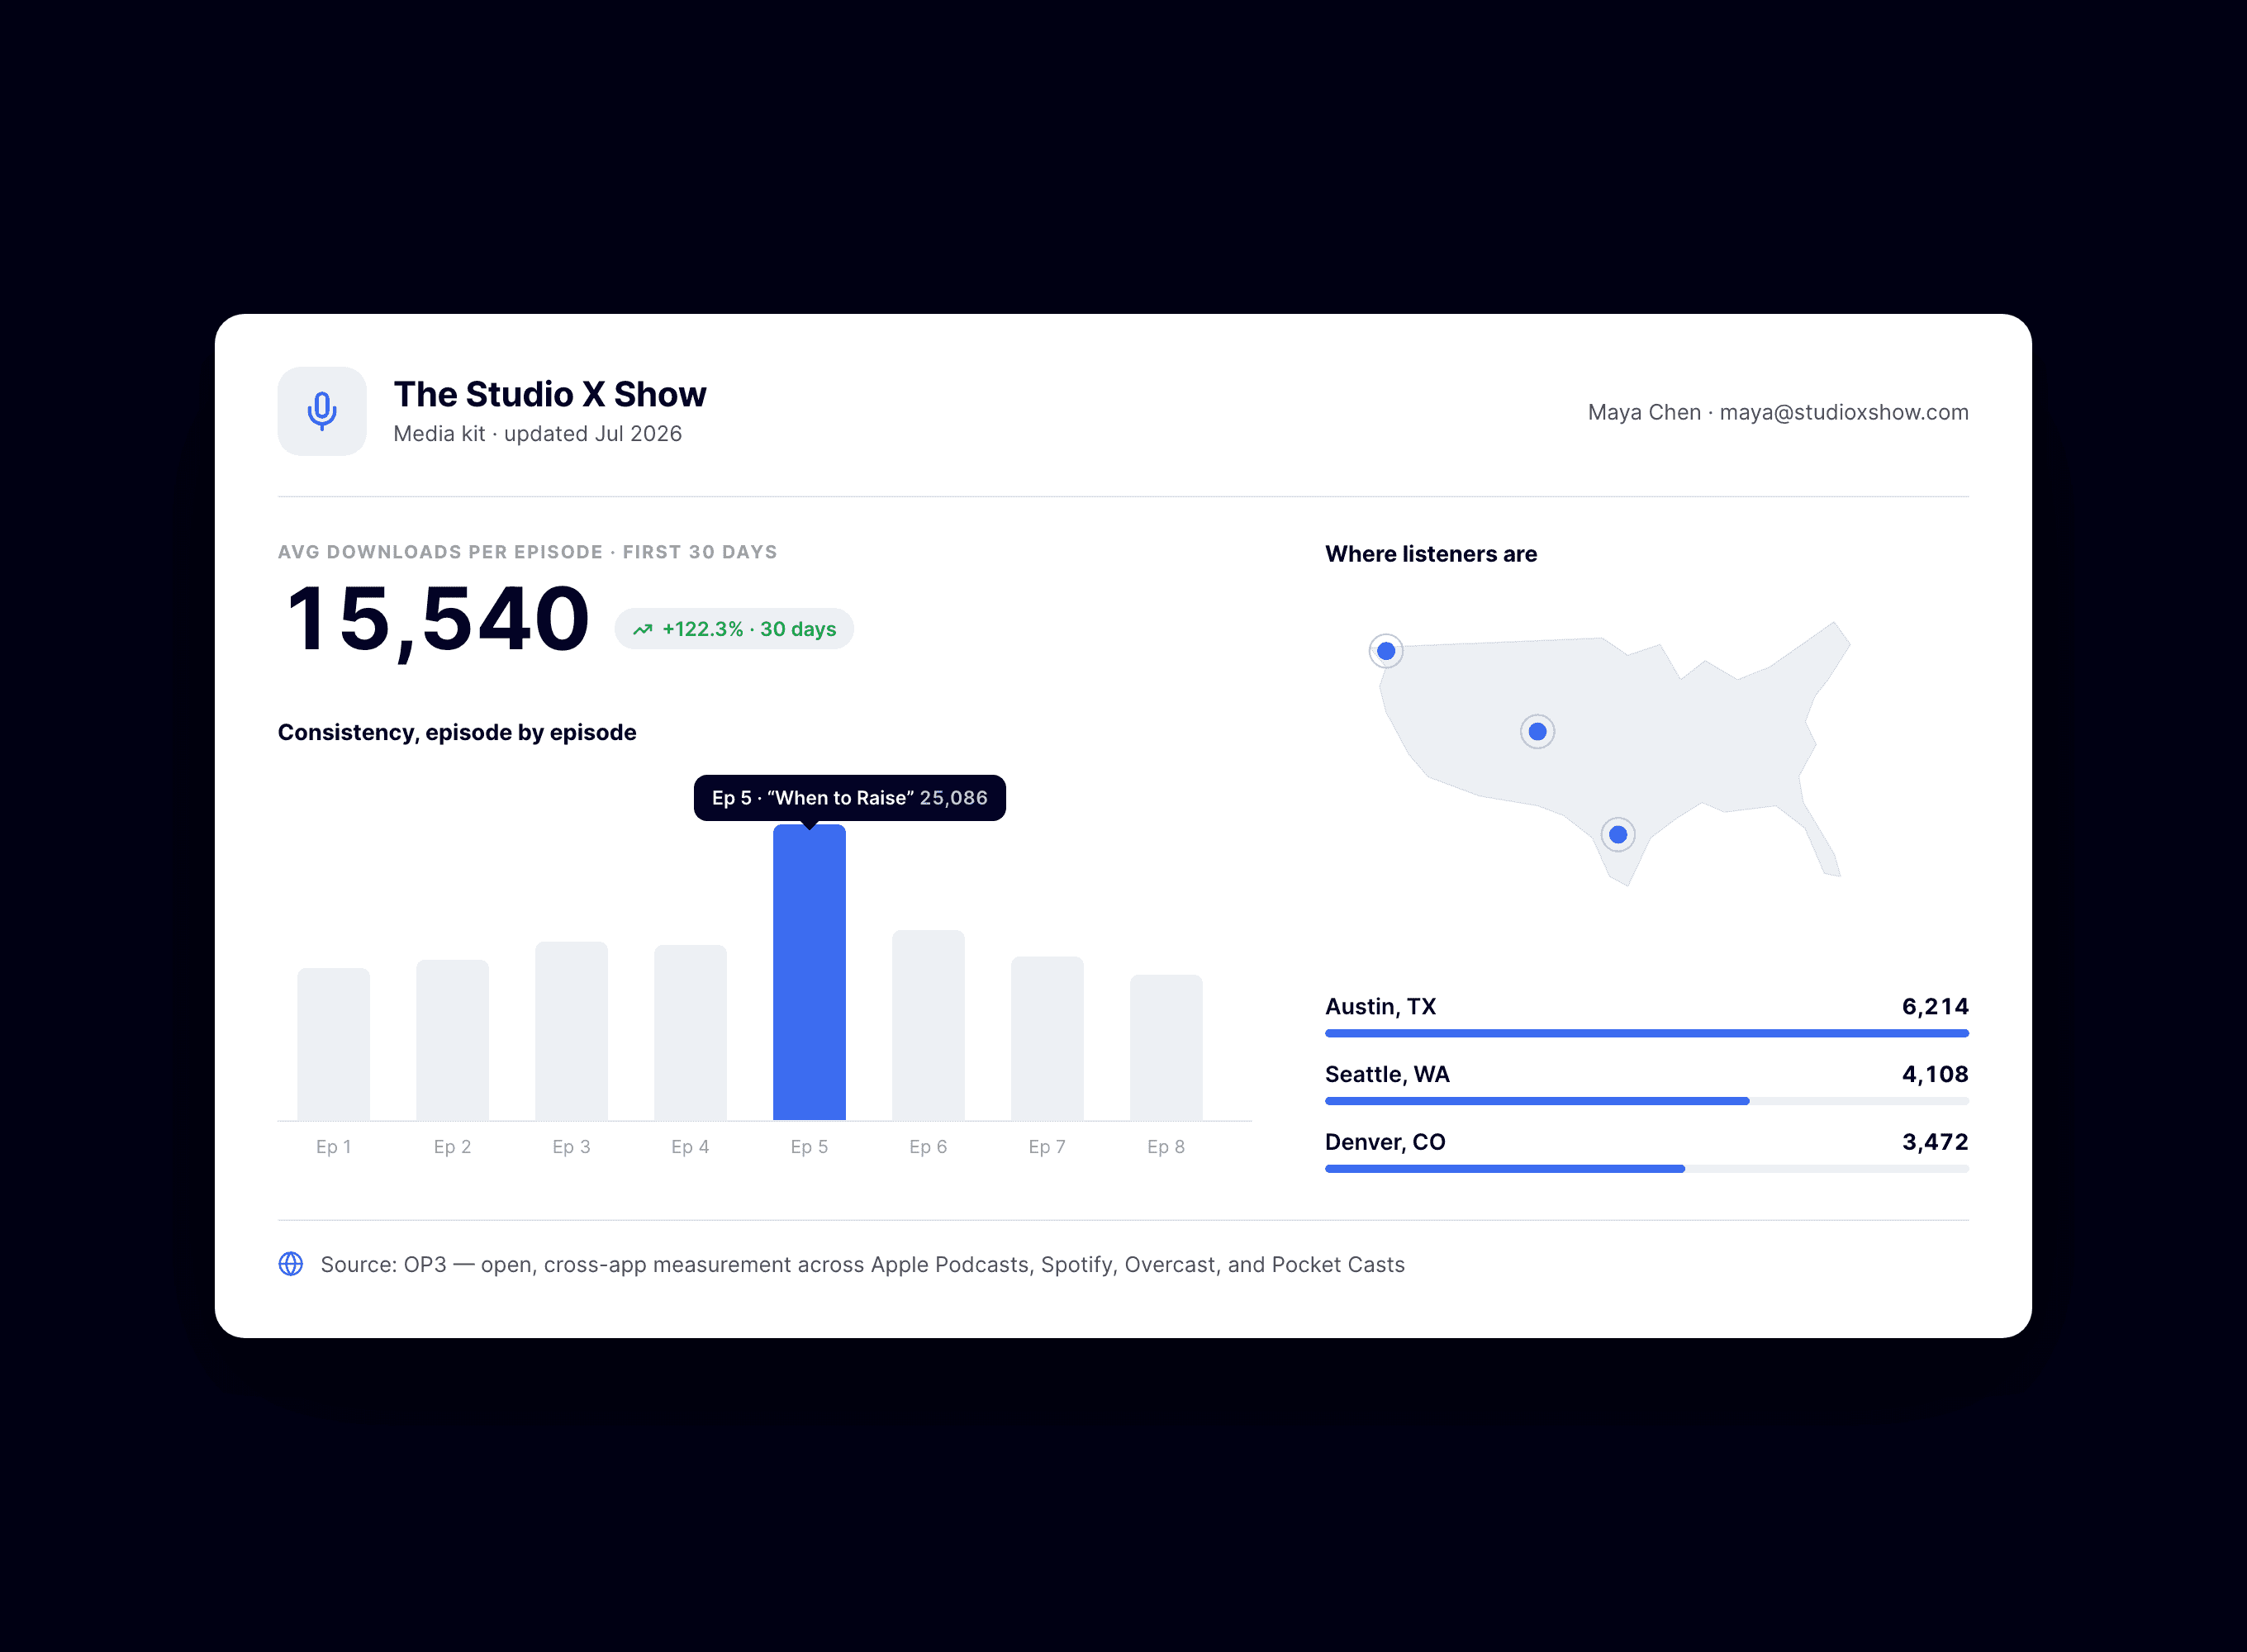
Downloads within 30 days of episode release is the standard unit sponsors buy against. It is what CPM pricing is quoted on, so it belongs at the top of your stats section in large type.
Use an average across your last ten or so episodes, and say that is what you did. “Averaging 4,300 downloads per episode in the first 30 days, across the last 10 episodes” is a sentence a buyer can underwrite.
Consistency beats a spike
One episode that went semi-viral is a fun story, but a buyer is purchasing your next episodes, not your best one. A tight range across recent releases is worth more than a big outlier.
Show it visually if you can: a small chart of per-episode downloads across the last quarter, or a simple range like “episodes land between 3,800 and 4,900.” Cadence counts here too — a show that ships weekly, every week, is easier to buy than one that publishes in bursts.
Geography and platform mix
Where your listeners are matters to almost every sponsor. A US-heavy audience means something different to an advertiser than a global one, and a concentration in specific metros can be the whole pitch for regional brands.
Platform mix — Apple Podcasts vs. Spotify vs. everything else — is a smaller but appreciated detail. It tells a sponsor how your audience listens and reassures them you actually know your own data.
Top 3–5 countries by share of downloads
Top US metros if you have meaningful concentration
Rough platform split across listening apps
What to leave out
Every stat you include should survive the question “would I buy against this?” Most padding fails that test instantly.
All-time total downloads — impressive-sounding, unbuyable
Social follower counts, unless the deal includes social posts
“Impressions” or “reach” without a definition
Unverifiable listener survey claims presented as hard demographics
One honest caveat: if a sponsor asks for age and gender breakdowns, be upfront that download-based podcast analytics generally can’t provide them reliably. Offering audience fit through your content and geography is more credible than inventing demographics.
Name your source
The fastest trust-builder in a media kit is a single line saying where the numbers come from. “Analytics via OP3, an open podcast prefix that counts downloads consistently across all listening apps” tells a buyer your numbers weren’t typed into a text box from memory.
Even better, offer the raw data: a CSV of recent episode performance attached to your pitch email says you have nothing to hide.
Conclusion
A media kit earns money when its stats section is short, honest, and buyable: 30-day downloads per episode, consistency, geography, platform mix, and a named source. Everything else is decoration.
If assembling those numbers means a scavenger hunt across dashboards, BuzzyPod puts OP3-powered downloads, a listener map, device breakdowns, and one-click CSV exports in one $10-a-month tool — so refreshing your media kit each quarter takes ten minutes.
Related reading
Introduction
A podcast media kit is your show’s résumé for advertisers, and the stats section is the part sponsors actually read. Get those numbers right and the rest of the kit is just nice formatting.
The problem is that most media kits bury the one number buyers care about under a pile of vanity metrics: total all-time downloads, social follower counts, “monthly impressions” of mysterious origin. Buyers have seen every trick, and padding reads as exactly what it is.
Here is what to include, what to cut, and how to present numbers so a media buyer trusts them on the first read.
Key takeaway
Lead with average downloads per episode within 30 days — it’s the number sponsors buy against
Show consistency across recent episodes, not one viral outlier
Geography and platform mix build trust and help sponsors qualify fit
Cut vanity metrics: all-time totals and follower counts read as padding
Say where your numbers come from; a verifiable source beats a bigger claim
The anatomy of a media kit
Before the numbers, a quick map. A working media kit typically has six parts, and it fits on one or two pages.
Show description and who it’s for
Audience stats (the section this post is about)
Listener geography
Ad formats and pricing
Past sponsors or notable episodes, if you have them
Contact details and how to book
The headline stat: 30-day downloads per episode
Downloads within 30 days of episode release is the standard unit sponsors buy against. It is what CPM pricing is quoted on, so it belongs at the top of your stats section in large type.
Use an average across your last ten or so episodes, and say that is what you did. “Averaging 4,300 downloads per episode in the first 30 days, across the last 10 episodes” is a sentence a buyer can underwrite.
Consistency beats a spike
One episode that went semi-viral is a fun story, but a buyer is purchasing your next episodes, not your best one. A tight range across recent releases is worth more than a big outlier.
Show it visually if you can: a small chart of per-episode downloads across the last quarter, or a simple range like “episodes land between 3,800 and 4,900.” Cadence counts here too — a show that ships weekly, every week, is easier to buy than one that publishes in bursts.
Geography and platform mix
Where your listeners are matters to almost every sponsor. A US-heavy audience means something different to an advertiser than a global one, and a concentration in specific metros can be the whole pitch for regional brands.
Platform mix — Apple Podcasts vs. Spotify vs. everything else — is a smaller but appreciated detail. It tells a sponsor how your audience listens and reassures them you actually know your own data.
Top 3–5 countries by share of downloads
Top US metros if you have meaningful concentration
Rough platform split across listening apps
What to leave out
Every stat you include should survive the question “would I buy against this?” Most padding fails that test instantly.
All-time total downloads — impressive-sounding, unbuyable
Social follower counts, unless the deal includes social posts
“Impressions” or “reach” without a definition
Unverifiable listener survey claims presented as hard demographics
One honest caveat: if a sponsor asks for age and gender breakdowns, be upfront that download-based podcast analytics generally can’t provide them reliably. Offering audience fit through your content and geography is more credible than inventing demographics.
Name your source
The fastest trust-builder in a media kit is a single line saying where the numbers come from. “Analytics via OP3, an open podcast prefix that counts downloads consistently across all listening apps” tells a buyer your numbers weren’t typed into a text box from memory.
Even better, offer the raw data: a CSV of recent episode performance attached to your pitch email says you have nothing to hide.
Conclusion
A media kit earns money when its stats section is short, honest, and buyable: 30-day downloads per episode, consistency, geography, platform mix, and a named source. Everything else is decoration.
If assembling those numbers means a scavenger hunt across dashboards, BuzzyPod puts OP3-powered downloads, a listener map, device breakdowns, and one-click CSV exports in one $10-a-month tool — so refreshing your media kit each quarter takes ten minutes.
Related reading
Introduction
A podcast media kit is your show’s résumé for advertisers, and the stats section is the part sponsors actually read. Get those numbers right and the rest of the kit is just nice formatting.
The problem is that most media kits bury the one number buyers care about under a pile of vanity metrics: total all-time downloads, social follower counts, “monthly impressions” of mysterious origin. Buyers have seen every trick, and padding reads as exactly what it is.
Here is what to include, what to cut, and how to present numbers so a media buyer trusts them on the first read.
Key takeaway
Lead with average downloads per episode within 30 days — it’s the number sponsors buy against
Show consistency across recent episodes, not one viral outlier
Geography and platform mix build trust and help sponsors qualify fit
Cut vanity metrics: all-time totals and follower counts read as padding
Say where your numbers come from; a verifiable source beats a bigger claim
The anatomy of a media kit
Before the numbers, a quick map. A working media kit typically has six parts, and it fits on one or two pages.
Show description and who it’s for
Audience stats (the section this post is about)
Listener geography
Ad formats and pricing
Past sponsors or notable episodes, if you have them
Contact details and how to book
The headline stat: 30-day downloads per episode
Downloads within 30 days of episode release is the standard unit sponsors buy against. It is what CPM pricing is quoted on, so it belongs at the top of your stats section in large type.
Use an average across your last ten or so episodes, and say that is what you did. “Averaging 4,300 downloads per episode in the first 30 days, across the last 10 episodes” is a sentence a buyer can underwrite.
Consistency beats a spike
One episode that went semi-viral is a fun story, but a buyer is purchasing your next episodes, not your best one. A tight range across recent releases is worth more than a big outlier.
Show it visually if you can: a small chart of per-episode downloads across the last quarter, or a simple range like “episodes land between 3,800 and 4,900.” Cadence counts here too — a show that ships weekly, every week, is easier to buy than one that publishes in bursts.
Geography and platform mix
Where your listeners are matters to almost every sponsor. A US-heavy audience means something different to an advertiser than a global one, and a concentration in specific metros can be the whole pitch for regional brands.
Platform mix — Apple Podcasts vs. Spotify vs. everything else — is a smaller but appreciated detail. It tells a sponsor how your audience listens and reassures them you actually know your own data.
Top 3–5 countries by share of downloads
Top US metros if you have meaningful concentration
Rough platform split across listening apps
What to leave out
Every stat you include should survive the question “would I buy against this?” Most padding fails that test instantly.
All-time total downloads — impressive-sounding, unbuyable
Social follower counts, unless the deal includes social posts
“Impressions” or “reach” without a definition
Unverifiable listener survey claims presented as hard demographics
One honest caveat: if a sponsor asks for age and gender breakdowns, be upfront that download-based podcast analytics generally can’t provide them reliably. Offering audience fit through your content and geography is more credible than inventing demographics.
Name your source
The fastest trust-builder in a media kit is a single line saying where the numbers come from. “Analytics via OP3, an open podcast prefix that counts downloads consistently across all listening apps” tells a buyer your numbers weren’t typed into a text box from memory.
Even better, offer the raw data: a CSV of recent episode performance attached to your pitch email says you have nothing to hide.
Conclusion
A media kit earns money when its stats section is short, honest, and buyable: 30-day downloads per episode, consistency, geography, platform mix, and a named source. Everything else is decoration.
If assembling those numbers means a scavenger hunt across dashboards, BuzzyPod puts OP3-powered downloads, a listener map, device breakdowns, and one-click CSV exports in one $10-a-month tool — so refreshing your media kit each quarter takes ten minutes.

