Podcast analytics explained: the metrics that actually matter

Nathaniel DeSantis
Podcast Analytics
Introduction
Podcast analytics have a reputation for being confusing, and honestly, they’ve earned it. Your host says one number, Apple says another, Spotify says a third, and none of them agree on what a “listen” even is.
The good news: once you understand what each metric actually measures, the fog clears fast. There are only a handful of numbers that genuinely matter for growing a show.
This guide walks through downloads, unique listeners, geography, apps and devices, and episode curves — plus the vanity metrics you can safely ignore.
Key takeaway
Downloads are the industry-standard metric; everything else is app-specific
Apple and Spotify only report activity inside their own apps
Geography and listening-app data are the most actionable audience insights
Per-episode curves reveal which topics actually work
Chart rankings and follower counts are mostly noise
Downloads: the metric everything else hangs on
A download happens when a listening app requests your episode’s audio file. The IAB v2 standard filters out bots, duplicate requests, and partial fetches, so one real person grabbing one episode counts once.
It’s not perfect — a download doesn’t prove someone listened to the whole thing — but it’s the one metric measured the same way across every app. That’s why advertisers price against it and why it should be your baseline.
Downloads and unique listeners are related but different. One devoted fan downloading your entire back catalog is many downloads, one listener. Most analytics tools report downloads because uniques require guessing at identity, which gets privacy-murky fast.
Why your numbers never match across dashboards
Every dashboard is counting a different slice of reality. Here’s what each source actually sees:
Your hosting provider estimates downloads from its own server logs — every app, but only its interpretation of the traffic
Apple Podcasts Connect reports followers and plays from the Apple Podcasts app only
Spotify for Creators counts streams and consumption inside Spotify only
Prefix-based services like OP3 measure the request before it reaches the file, the same way for every app
None of these are lying. They’re answering different questions. The trick is picking one consistent, cross-app source as your primary number and treating the platform dashboards as supplements.
Geography: the audience data you can actually trust
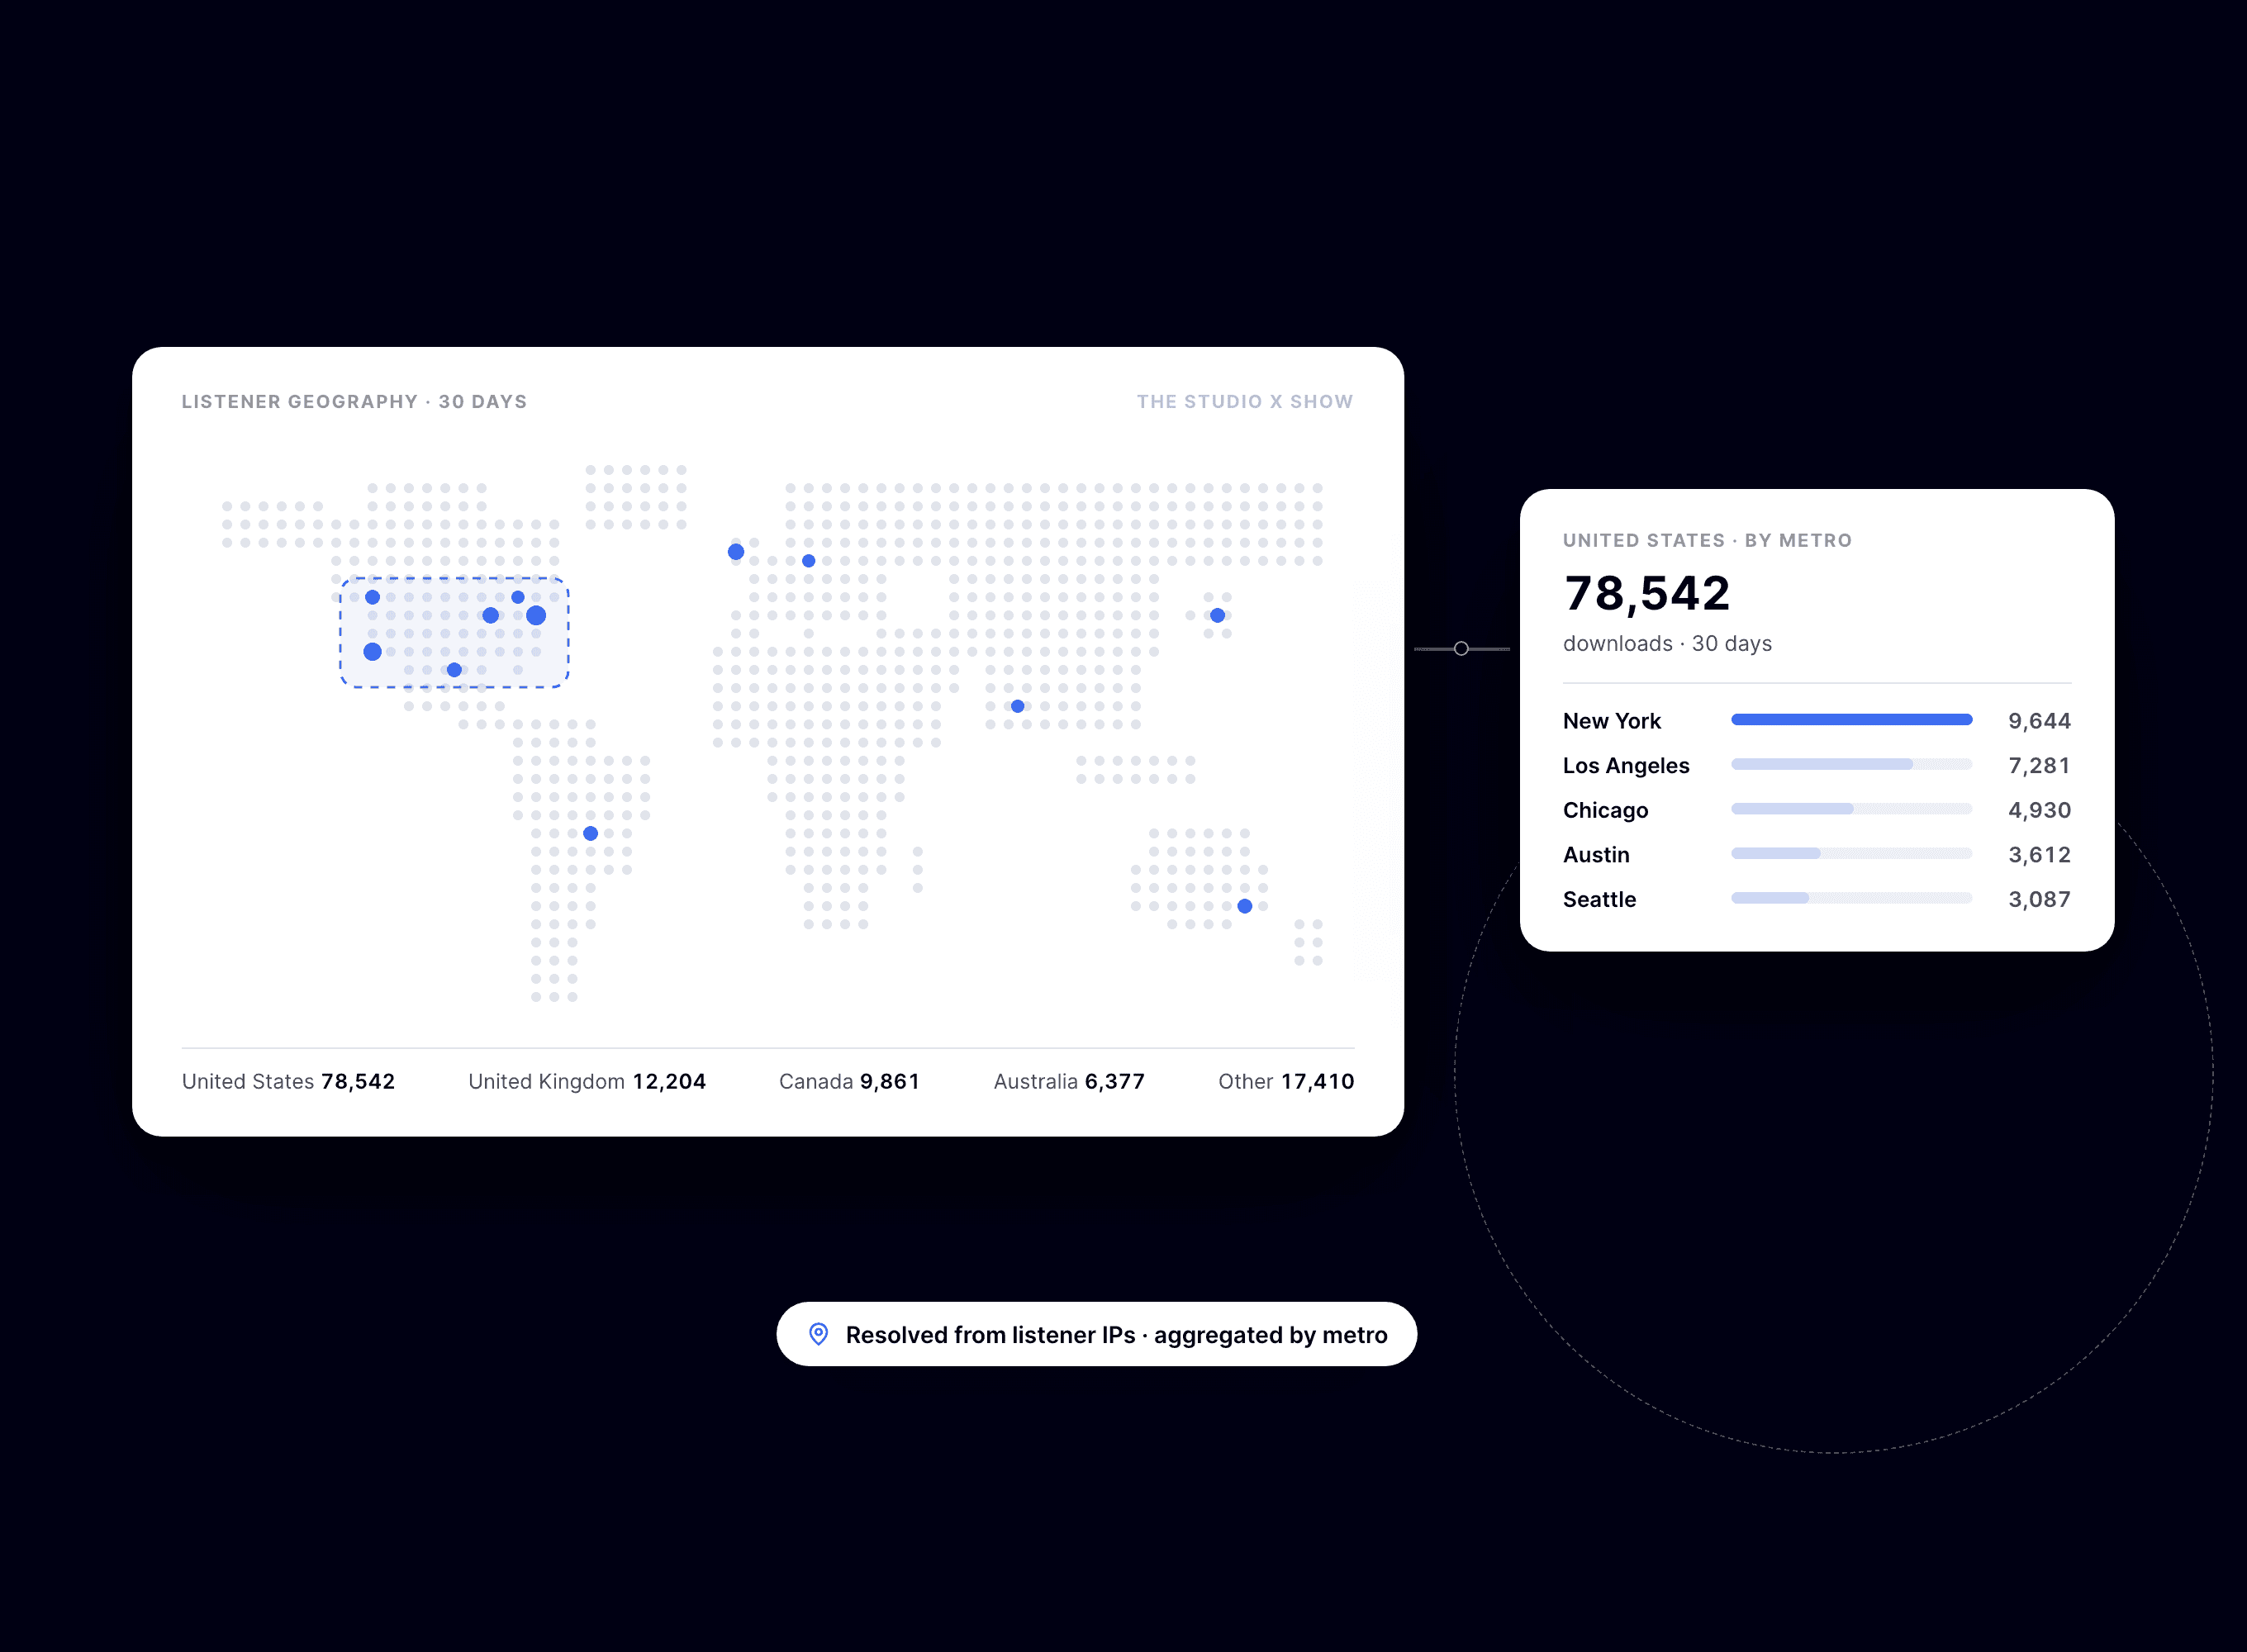
Age and gender demographics for podcasts are mostly survey-based guesswork, but geography comes straight from download data and it’s reliable. Country-level and US-metro-level data tells you real things:
Where to focus live events, meetups, or local partnerships
Which sponsors make sense — a US-heavy audience wants US-relevant ads
Whether an international audience justifies show notes, transcripts, or references that travel
Which metros are over-indexing, which is gold for local advertisers
Apps and devices: know where your audience actually listens
Knowing that 40% of your audience is on Apple Podcasts and 30% is on Spotify changes real decisions. If Overcast listeners are a big slice, chapters matter. If Spotify dominates, your episode descriptions do more work there.
App breakdowns also help you sanity-check platform dashboards. If a third of your downloads come from Apple Podcasts, Apple’s numbers should be roughly a third of your cross-app total — a quick way to confirm everything’s wired up correctly.
Episode curves: where the real insight lives
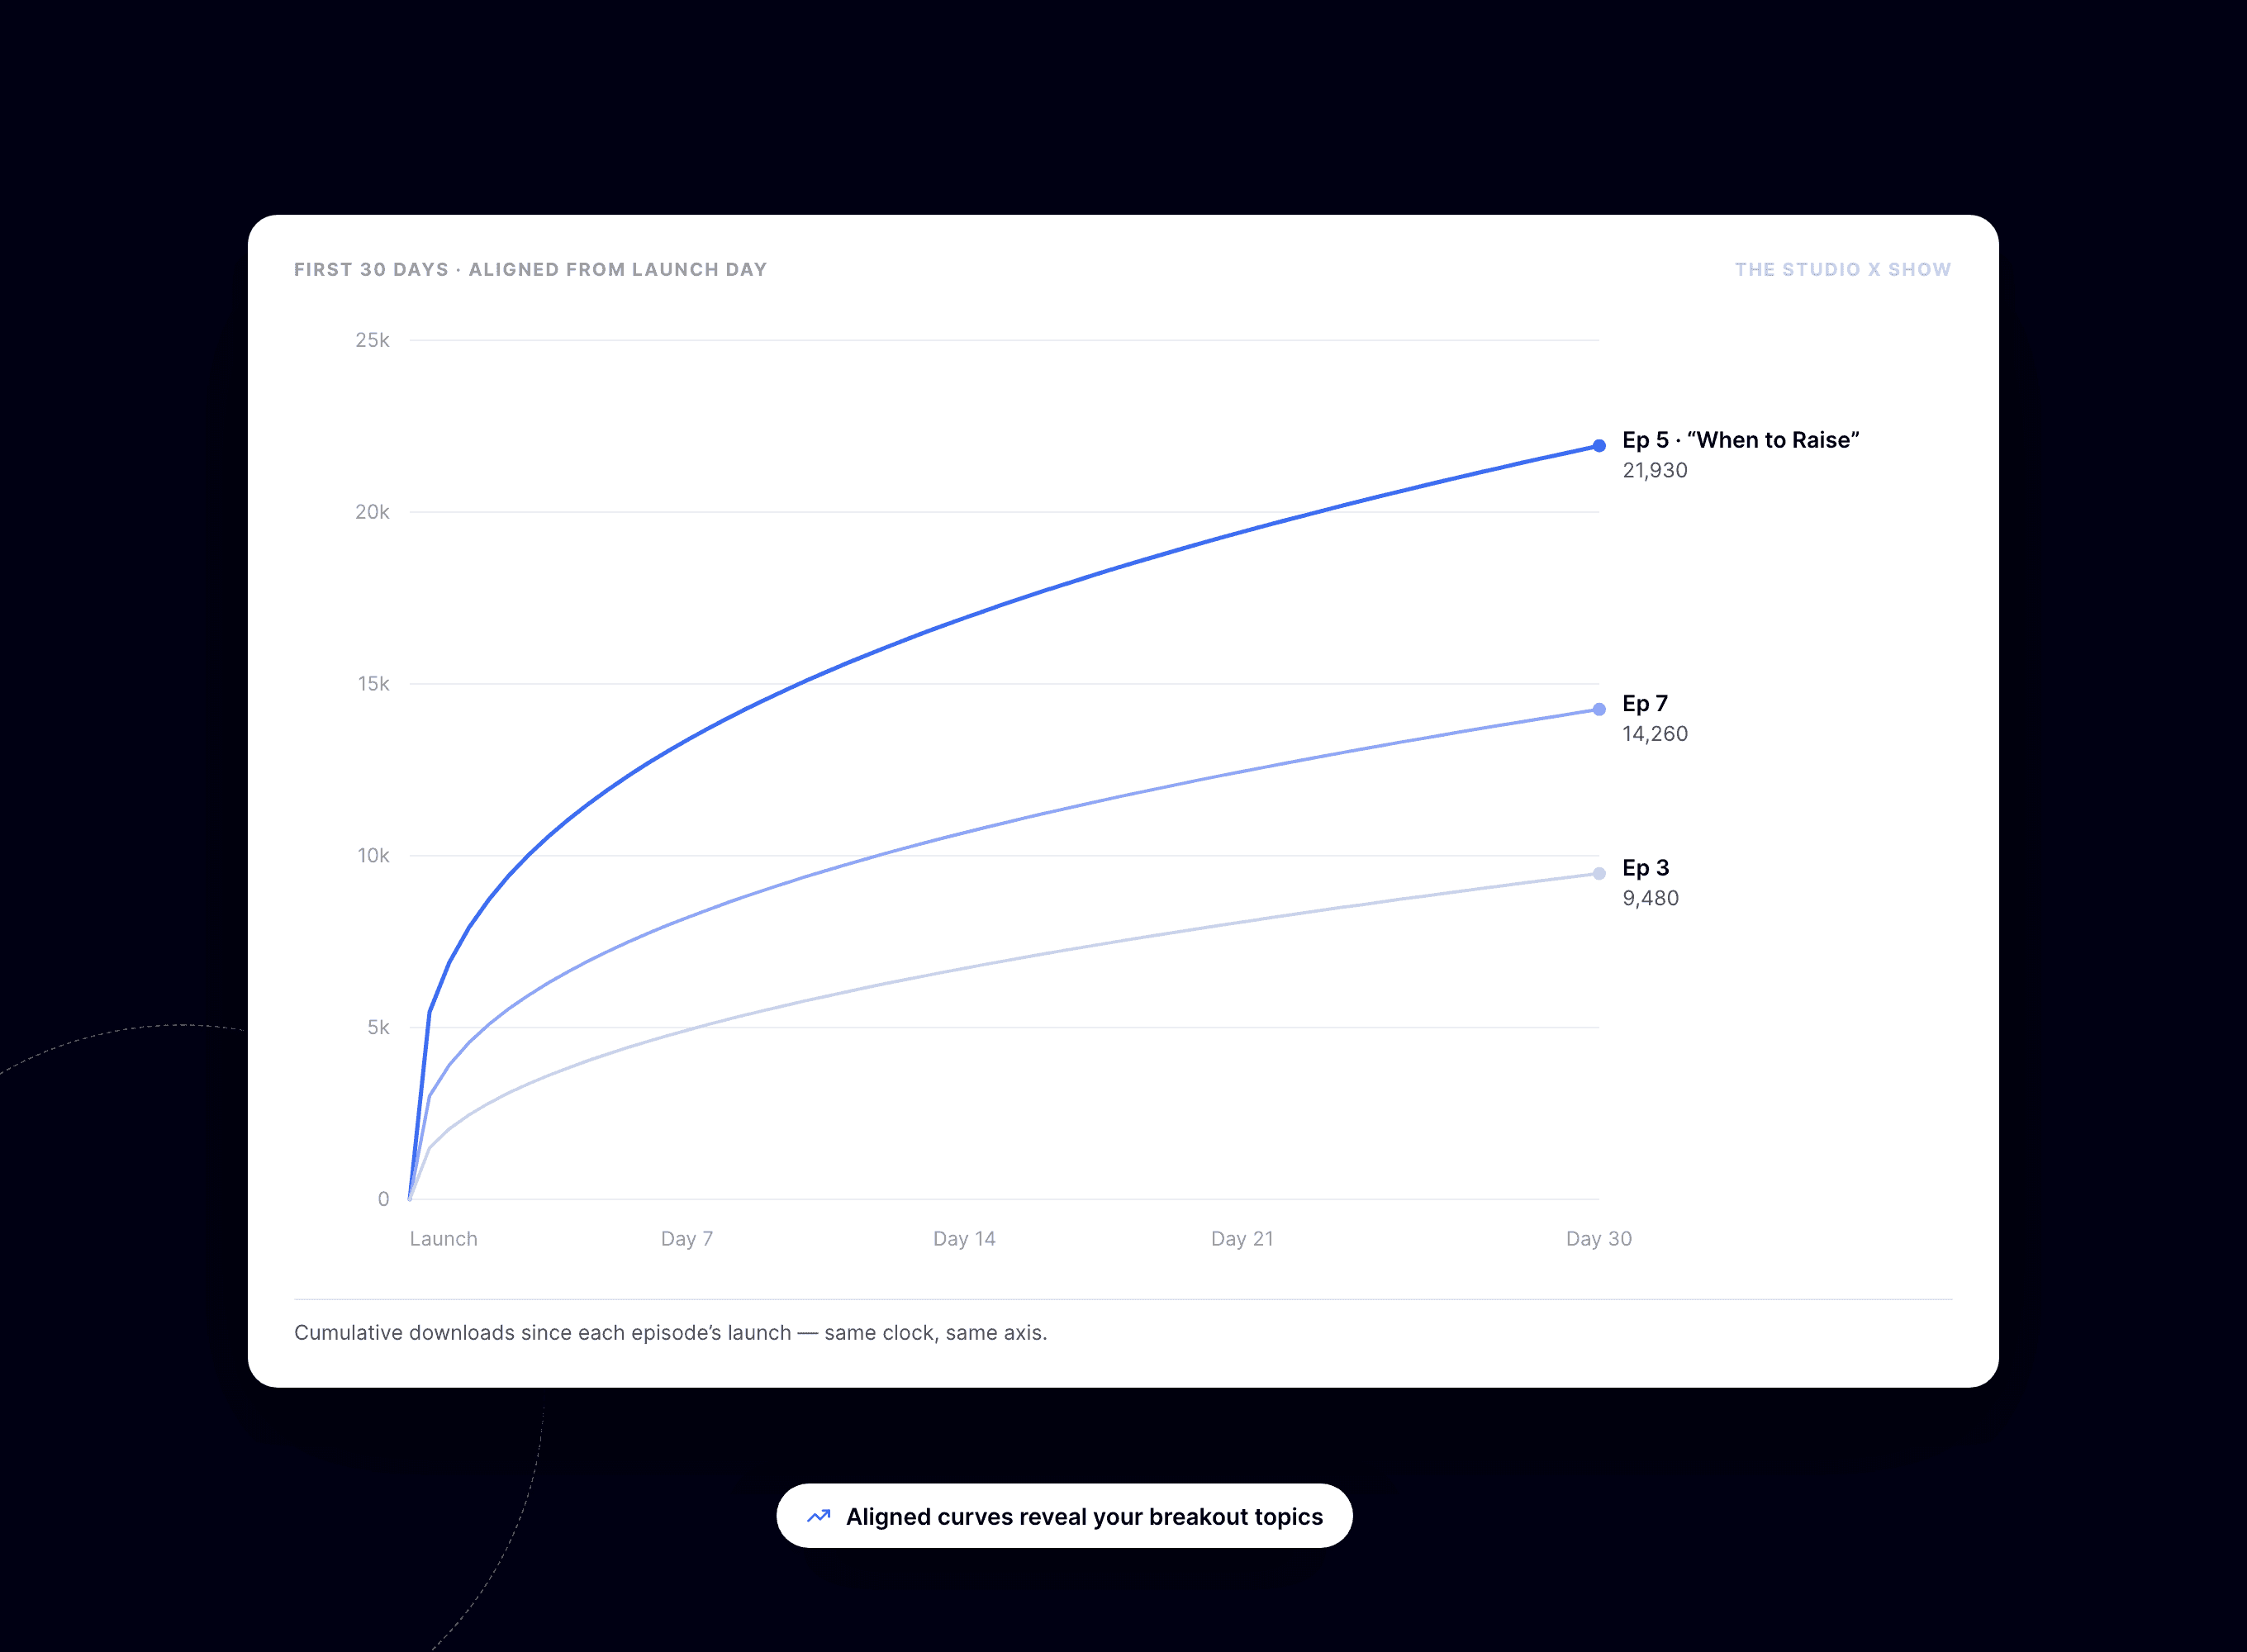
A single total per episode hides the story. A download curve — downloads per day from launch — shows you the shape of an episode’s life: the release-day spike, the first-week decay, and the long tail from new listeners finding your back catalog.
The most useful trick is comparing episodes aligned day-by-day from launch. Episode 42 at day 14 versus episode 43 at day 14 is a fair fight; comparing raw totals when one episode is three months older is not.
Vanity metrics you can stop worrying about
Some numbers feel important and mostly aren’t:
Chart rankings — driven by follow velocity in short windows, easily gamed, and they don’t pay bills
Total all-time downloads — always goes up, tells you nothing about trajectory
Social follower counts — nice, but they’re not listeners until they download
Five-star ratings — lovely for morale, weak as a growth signal
If a metric can’t change a decision about what you make next, it’s decoration.
Conclusion
Podcast analytics get simple once you anchor on cross-app downloads, use geography and app data to make decisions, and read episode curves instead of raw totals. Everything else is a supplement or a distraction.
If you want all of that in one place — open OP3-powered downloads, a world map, per-episode curves, and launch-day comparisons — BuzzyPod puts it in a single $10/month dashboard with a 14-day free trial.
Related reading
Introduction
Podcast analytics have a reputation for being confusing, and honestly, they’ve earned it. Your host says one number, Apple says another, Spotify says a third, and none of them agree on what a “listen” even is.
The good news: once you understand what each metric actually measures, the fog clears fast. There are only a handful of numbers that genuinely matter for growing a show.
This guide walks through downloads, unique listeners, geography, apps and devices, and episode curves — plus the vanity metrics you can safely ignore.
Key takeaway
Downloads are the industry-standard metric; everything else is app-specific
Apple and Spotify only report activity inside their own apps
Geography and listening-app data are the most actionable audience insights
Per-episode curves reveal which topics actually work
Chart rankings and follower counts are mostly noise
Downloads: the metric everything else hangs on
A download happens when a listening app requests your episode’s audio file. The IAB v2 standard filters out bots, duplicate requests, and partial fetches, so one real person grabbing one episode counts once.
It’s not perfect — a download doesn’t prove someone listened to the whole thing — but it’s the one metric measured the same way across every app. That’s why advertisers price against it and why it should be your baseline.
Downloads and unique listeners are related but different. One devoted fan downloading your entire back catalog is many downloads, one listener. Most analytics tools report downloads because uniques require guessing at identity, which gets privacy-murky fast.
Why your numbers never match across dashboards
Every dashboard is counting a different slice of reality. Here’s what each source actually sees:
Your hosting provider estimates downloads from its own server logs — every app, but only its interpretation of the traffic
Apple Podcasts Connect reports followers and plays from the Apple Podcasts app only
Spotify for Creators counts streams and consumption inside Spotify only
Prefix-based services like OP3 measure the request before it reaches the file, the same way for every app
None of these are lying. They’re answering different questions. The trick is picking one consistent, cross-app source as your primary number and treating the platform dashboards as supplements.
Geography: the audience data you can actually trust
Age and gender demographics for podcasts are mostly survey-based guesswork, but geography comes straight from download data and it’s reliable. Country-level and US-metro-level data tells you real things:
Where to focus live events, meetups, or local partnerships
Which sponsors make sense — a US-heavy audience wants US-relevant ads
Whether an international audience justifies show notes, transcripts, or references that travel
Which metros are over-indexing, which is gold for local advertisers
Apps and devices: know where your audience actually listens
Knowing that 40% of your audience is on Apple Podcasts and 30% is on Spotify changes real decisions. If Overcast listeners are a big slice, chapters matter. If Spotify dominates, your episode descriptions do more work there.
App breakdowns also help you sanity-check platform dashboards. If a third of your downloads come from Apple Podcasts, Apple’s numbers should be roughly a third of your cross-app total — a quick way to confirm everything’s wired up correctly.
Episode curves: where the real insight lives
A single total per episode hides the story. A download curve — downloads per day from launch — shows you the shape of an episode’s life: the release-day spike, the first-week decay, and the long tail from new listeners finding your back catalog.
The most useful trick is comparing episodes aligned day-by-day from launch. Episode 42 at day 14 versus episode 43 at day 14 is a fair fight; comparing raw totals when one episode is three months older is not.
Vanity metrics you can stop worrying about
Some numbers feel important and mostly aren’t:
Chart rankings — driven by follow velocity in short windows, easily gamed, and they don’t pay bills
Total all-time downloads — always goes up, tells you nothing about trajectory
Social follower counts — nice, but they’re not listeners until they download
Five-star ratings — lovely for morale, weak as a growth signal
If a metric can’t change a decision about what you make next, it’s decoration.
Conclusion
Podcast analytics get simple once you anchor on cross-app downloads, use geography and app data to make decisions, and read episode curves instead of raw totals. Everything else is a supplement or a distraction.
If you want all of that in one place — open OP3-powered downloads, a world map, per-episode curves, and launch-day comparisons — BuzzyPod puts it in a single $10/month dashboard with a 14-day free trial.
Related reading
Introduction
Podcast analytics have a reputation for being confusing, and honestly, they’ve earned it. Your host says one number, Apple says another, Spotify says a third, and none of them agree on what a “listen” even is.
The good news: once you understand what each metric actually measures, the fog clears fast. There are only a handful of numbers that genuinely matter for growing a show.
This guide walks through downloads, unique listeners, geography, apps and devices, and episode curves — plus the vanity metrics you can safely ignore.
Key takeaway
Downloads are the industry-standard metric; everything else is app-specific
Apple and Spotify only report activity inside their own apps
Geography and listening-app data are the most actionable audience insights
Per-episode curves reveal which topics actually work
Chart rankings and follower counts are mostly noise
Downloads: the metric everything else hangs on
A download happens when a listening app requests your episode’s audio file. The IAB v2 standard filters out bots, duplicate requests, and partial fetches, so one real person grabbing one episode counts once.
It’s not perfect — a download doesn’t prove someone listened to the whole thing — but it’s the one metric measured the same way across every app. That’s why advertisers price against it and why it should be your baseline.
Downloads and unique listeners are related but different. One devoted fan downloading your entire back catalog is many downloads, one listener. Most analytics tools report downloads because uniques require guessing at identity, which gets privacy-murky fast.
Why your numbers never match across dashboards
Every dashboard is counting a different slice of reality. Here’s what each source actually sees:
Your hosting provider estimates downloads from its own server logs — every app, but only its interpretation of the traffic
Apple Podcasts Connect reports followers and plays from the Apple Podcasts app only
Spotify for Creators counts streams and consumption inside Spotify only
Prefix-based services like OP3 measure the request before it reaches the file, the same way for every app
None of these are lying. They’re answering different questions. The trick is picking one consistent, cross-app source as your primary number and treating the platform dashboards as supplements.
Geography: the audience data you can actually trust
Age and gender demographics for podcasts are mostly survey-based guesswork, but geography comes straight from download data and it’s reliable. Country-level and US-metro-level data tells you real things:
Where to focus live events, meetups, or local partnerships
Which sponsors make sense — a US-heavy audience wants US-relevant ads
Whether an international audience justifies show notes, transcripts, or references that travel
Which metros are over-indexing, which is gold for local advertisers
Apps and devices: know where your audience actually listens
Knowing that 40% of your audience is on Apple Podcasts and 30% is on Spotify changes real decisions. If Overcast listeners are a big slice, chapters matter. If Spotify dominates, your episode descriptions do more work there.
App breakdowns also help you sanity-check platform dashboards. If a third of your downloads come from Apple Podcasts, Apple’s numbers should be roughly a third of your cross-app total — a quick way to confirm everything’s wired up correctly.
Episode curves: where the real insight lives
A single total per episode hides the story. A download curve — downloads per day from launch — shows you the shape of an episode’s life: the release-day spike, the first-week decay, and the long tail from new listeners finding your back catalog.
The most useful trick is comparing episodes aligned day-by-day from launch. Episode 42 at day 14 versus episode 43 at day 14 is a fair fight; comparing raw totals when one episode is three months older is not.
Vanity metrics you can stop worrying about
Some numbers feel important and mostly aren’t:
Chart rankings — driven by follow velocity in short windows, easily gamed, and they don’t pay bills
Total all-time downloads — always goes up, tells you nothing about trajectory
Social follower counts — nice, but they’re not listeners until they download
Five-star ratings — lovely for morale, weak as a growth signal
If a metric can’t change a decision about what you make next, it’s decoration.
Conclusion
Podcast analytics get simple once you anchor on cross-app downloads, use geography and app data to make decisions, and read episode curves instead of raw totals. Everything else is a supplement or a distraction.
If you want all of that in one place — open OP3-powered downloads, a world map, per-episode curves, and launch-day comparisons — BuzzyPod puts it in a single $10/month dashboard with a 14-day free trial.

