How to export podcast analytics to CSV for sponsors, clients, and planning

Nathaniel DeSantis
Sponsorship & Monetization

Introduction
Sooner or later, every podcaster needs to export podcast analytics to CSV — for a sponsor report, a client update, or just to plan next quarter without squinting at a dashboard.
The usual workaround is screenshots. Crop the chart, paste it into an email, hope nobody asks a follow-up question. It works right up until someone wants to compare your numbers to anything, at which point a photo of a graph is worth exactly nothing.
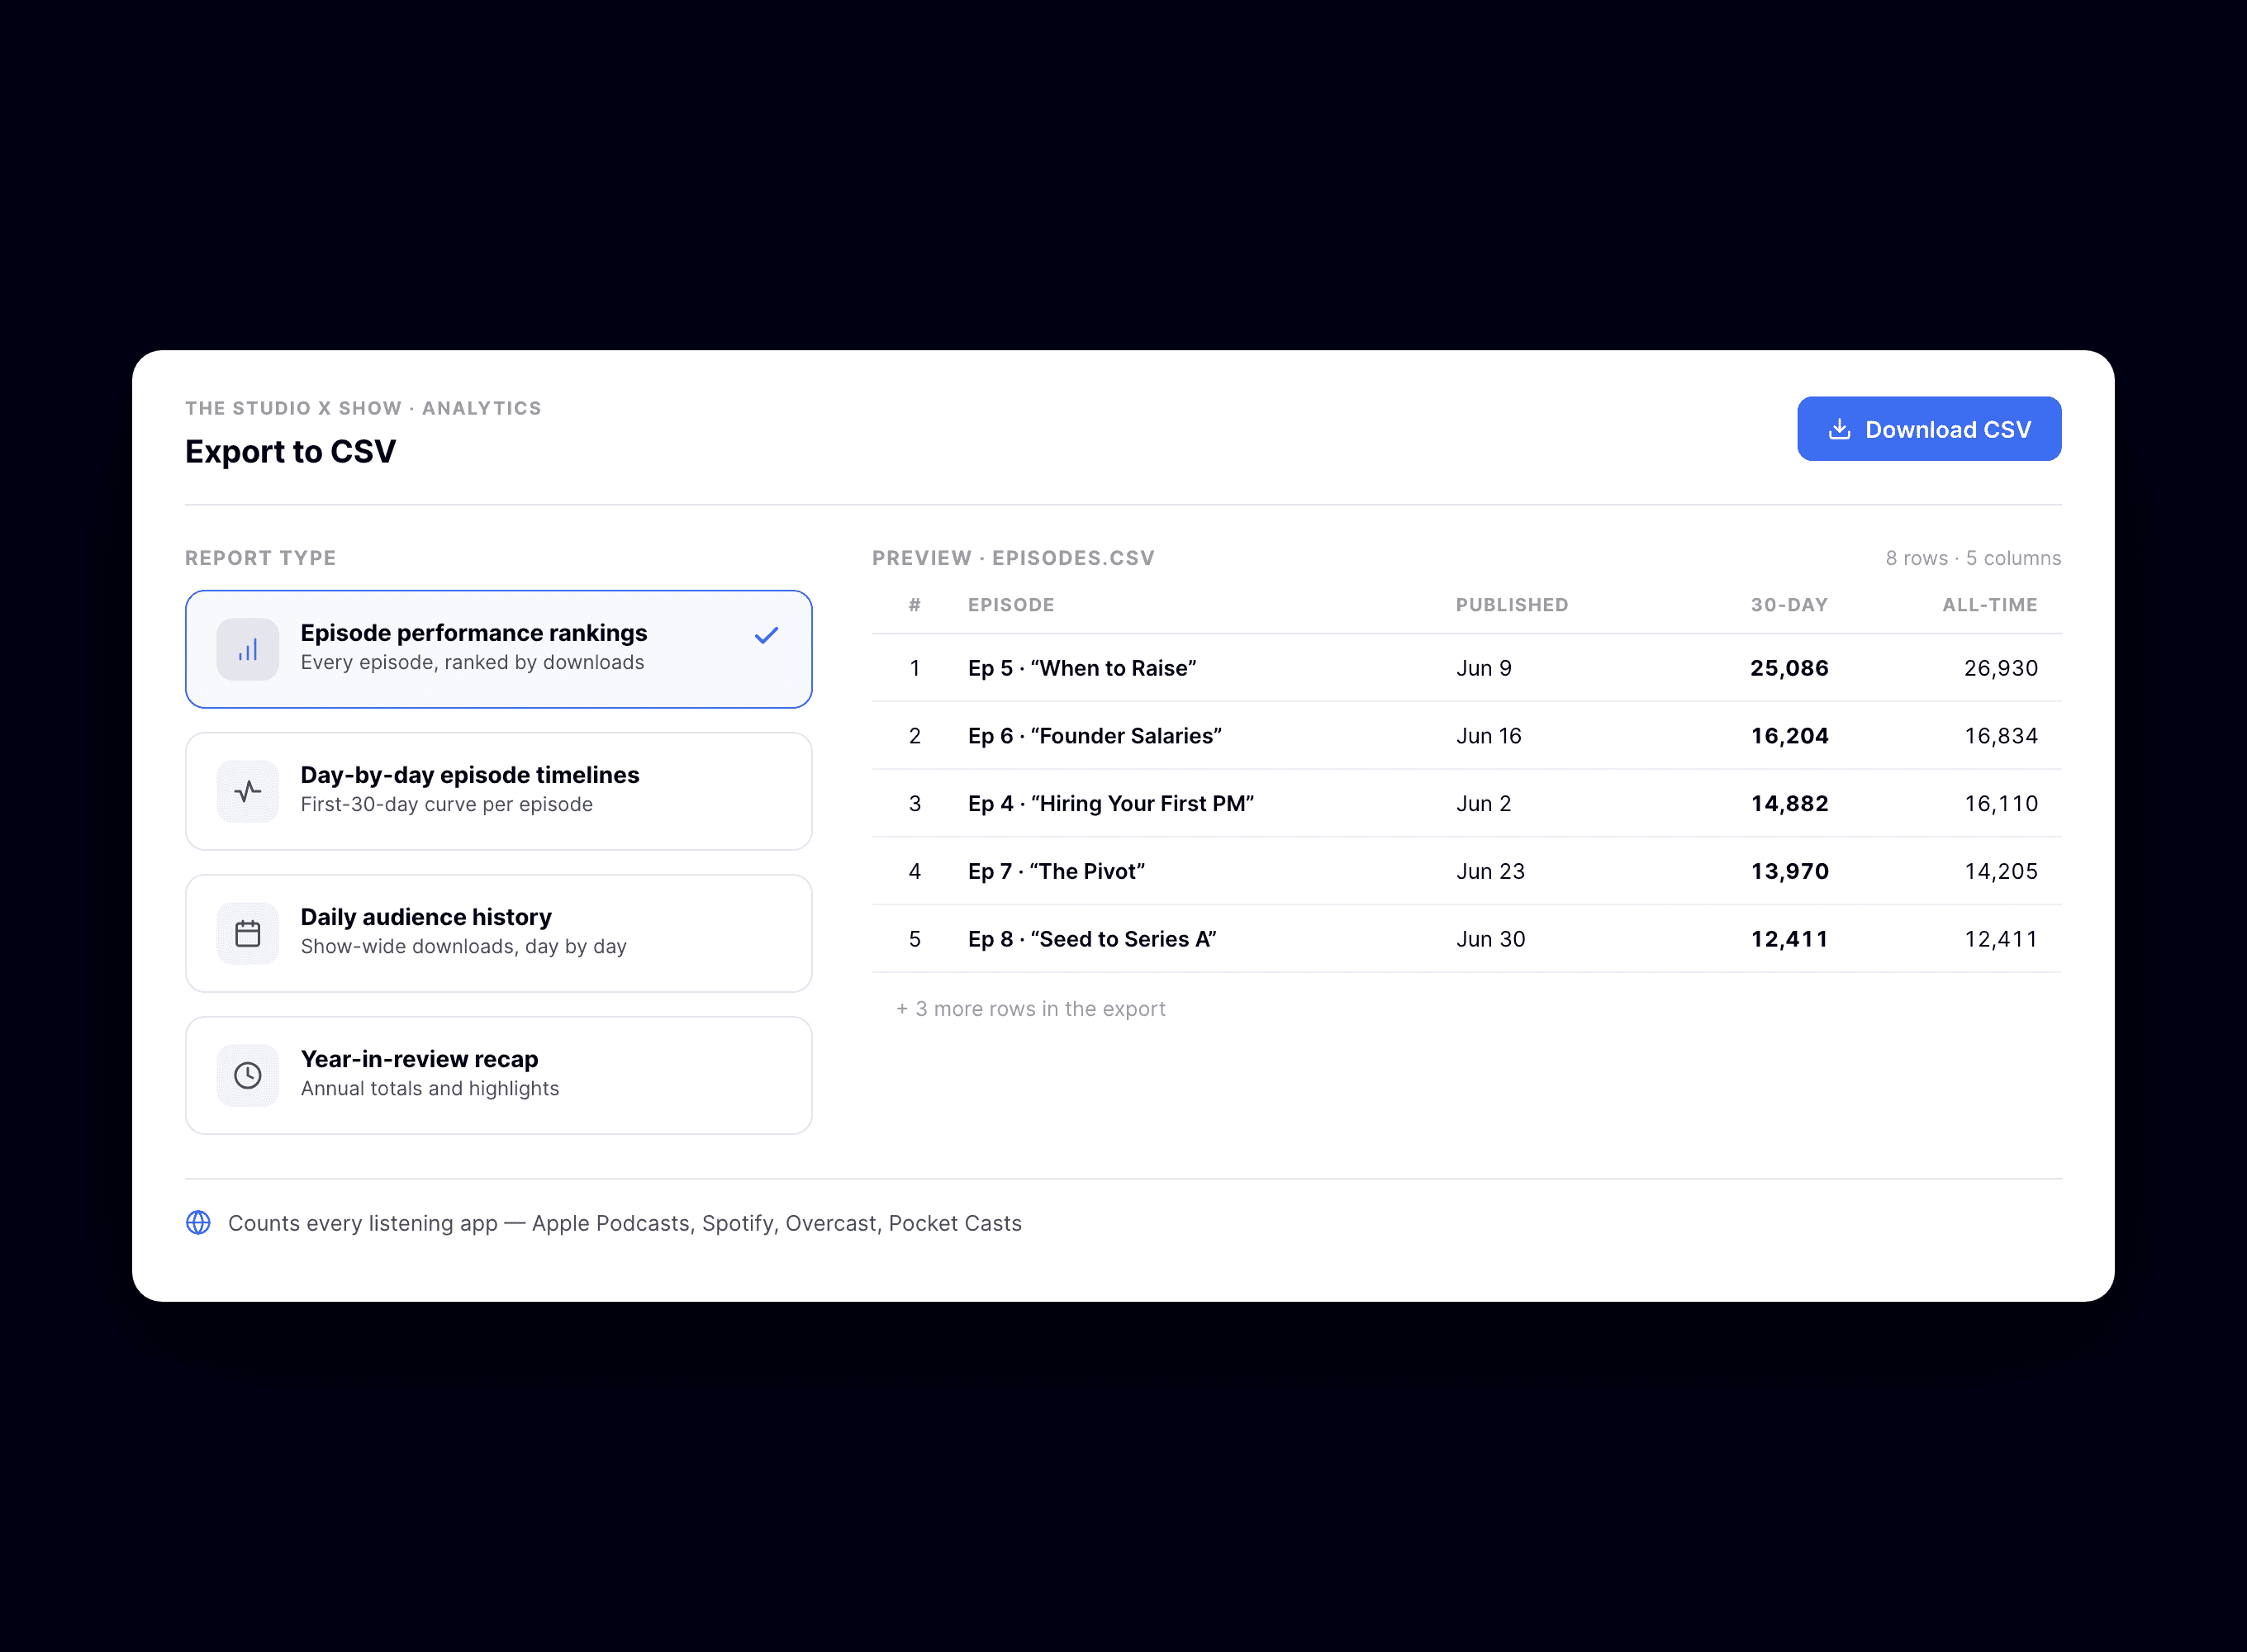
This guide covers why CSV is the right format, the four report types worth exporting, and a quick walkthrough of doing it in BuzzyPod.
Key takeaway
CSVs can be sorted, charted, and merged; screenshots can only be admired
Four exports cover almost every need: rankings, episode timelines, daily audience, year-in-review
Sponsors and clients trust raw data more than cropped dashboard images
Match the report to the question — per-episode questions need timelines, trend questions need daily history
A good export opens cleanly in Excel, Google Sheets, or Numbers with zero cleanup
Why CSV beats screenshots
A CSV is a working document. The person receiving it can sort by column, build their own chart, join it with their sales data, and answer their next three questions without emailing you back.
Sponsors can drop your numbers into their own campaign spreadsheets
Clients can verify claims instead of taking your crop job on faith
You can do real planning: pivot tables, moving averages, season-over-season comparisons
It archives cleanly — a folder of CSVs is a history; a folder of screenshots is a scrapbook
The four report types and what each is for
Most analytics questions map to one of four exports. Knowing which to reach for saves you from downloading everything and drowning in tabs.
Episode performance rankings
Every episode ranked by downloads. Use it for media kits, deciding which formats to double down on, and giving sponsored episodes context inside your catalog.
Day-by-day episode timelines
One episode’s downloads, day by day, from release onward. This is the sponsor-report workhorse: it shows delivery across an ad flight and how long an episode keeps earning.
Daily audience history
Total show downloads per day across all episodes. Use it for trend lines, spotting seasonality, and answering “is the show actually growing?” with a chart instead of a feeling.
Year-in-review recap
A whole year summarized in one file. Use it for annual planning, investor or client updates, and the January episode where you tell listeners how the year went.
Exporting from BuzzyPod: the walkthrough
BuzzyPod keeps this deliberately boring, which is the highest compliment you can pay an export feature.
Open your BuzzyPod dashboard and head to exports
Pick the report type: rankings, episode timeline, daily audience, or year-in-review
Preview the data so you know exactly what’s in the file
Click download — the CSV lands immediately, no export queue, no “we’ll email it to you”
The files are clean CSVs that open directly in Excel, Google Sheets, or Numbers. No mystery encodings, no header rows of marketing fluff to delete before row one.
What makes the numbers worth exporting
An export is only as good as the counting behind it. BuzzyPod’s analytics run on OP3, an open, prefix-based measurement service that counts downloads consistently across all listening apps.
That consistency matters when your CSV lands in a media buyer’s spreadsheet next to numbers from other shows. Data from an open, inspectable source travels better than data from a black box.
Three habits that make exports useful
Export daily audience history monthly and keep a running archive folder
Pull an episode timeline the day an ad flight ends, while the renewal conversation is warm
Send sponsors the CSV plus a three-sentence summary — narrative up top, data attached
Conclusion
Exporting analytics to CSV turns your podcast data from something you look at into something you can use — for sponsors, for clients, and for your own planning.
If your current host makes exporting feel like filing a records request, BuzzyPod offers one-click CSVs for rankings, timelines, daily audience, and a year-in-review recap, with a 14-day free trial to test it on your own show.
Related reading
Introduction
Sooner or later, every podcaster needs to export podcast analytics to CSV — for a sponsor report, a client update, or just to plan next quarter without squinting at a dashboard.
The usual workaround is screenshots. Crop the chart, paste it into an email, hope nobody asks a follow-up question. It works right up until someone wants to compare your numbers to anything, at which point a photo of a graph is worth exactly nothing.
This guide covers why CSV is the right format, the four report types worth exporting, and a quick walkthrough of doing it in BuzzyPod.
Key takeaway
CSVs can be sorted, charted, and merged; screenshots can only be admired
Four exports cover almost every need: rankings, episode timelines, daily audience, year-in-review
Sponsors and clients trust raw data more than cropped dashboard images
Match the report to the question — per-episode questions need timelines, trend questions need daily history
A good export opens cleanly in Excel, Google Sheets, or Numbers with zero cleanup
Why CSV beats screenshots
A CSV is a working document. The person receiving it can sort by column, build their own chart, join it with their sales data, and answer their next three questions without emailing you back.
Sponsors can drop your numbers into their own campaign spreadsheets
Clients can verify claims instead of taking your crop job on faith
You can do real planning: pivot tables, moving averages, season-over-season comparisons
It archives cleanly — a folder of CSVs is a history; a folder of screenshots is a scrapbook
The four report types and what each is for
Most analytics questions map to one of four exports. Knowing which to reach for saves you from downloading everything and drowning in tabs.
Episode performance rankings
Every episode ranked by downloads. Use it for media kits, deciding which formats to double down on, and giving sponsored episodes context inside your catalog.
Day-by-day episode timelines
One episode’s downloads, day by day, from release onward. This is the sponsor-report workhorse: it shows delivery across an ad flight and how long an episode keeps earning.
Daily audience history
Total show downloads per day across all episodes. Use it for trend lines, spotting seasonality, and answering “is the show actually growing?” with a chart instead of a feeling.
Year-in-review recap
A whole year summarized in one file. Use it for annual planning, investor or client updates, and the January episode where you tell listeners how the year went.
Exporting from BuzzyPod: the walkthrough
BuzzyPod keeps this deliberately boring, which is the highest compliment you can pay an export feature.
Open your BuzzyPod dashboard and head to exports
Pick the report type: rankings, episode timeline, daily audience, or year-in-review
Preview the data so you know exactly what’s in the file
Click download — the CSV lands immediately, no export queue, no “we’ll email it to you”
The files are clean CSVs that open directly in Excel, Google Sheets, or Numbers. No mystery encodings, no header rows of marketing fluff to delete before row one.
What makes the numbers worth exporting
An export is only as good as the counting behind it. BuzzyPod’s analytics run on OP3, an open, prefix-based measurement service that counts downloads consistently across all listening apps.
That consistency matters when your CSV lands in a media buyer’s spreadsheet next to numbers from other shows. Data from an open, inspectable source travels better than data from a black box.
Three habits that make exports useful
Export daily audience history monthly and keep a running archive folder
Pull an episode timeline the day an ad flight ends, while the renewal conversation is warm
Send sponsors the CSV plus a three-sentence summary — narrative up top, data attached
Conclusion
Exporting analytics to CSV turns your podcast data from something you look at into something you can use — for sponsors, for clients, and for your own planning.
If your current host makes exporting feel like filing a records request, BuzzyPod offers one-click CSVs for rankings, timelines, daily audience, and a year-in-review recap, with a 14-day free trial to test it on your own show.
Related reading
Introduction
Sooner or later, every podcaster needs to export podcast analytics to CSV — for a sponsor report, a client update, or just to plan next quarter without squinting at a dashboard.
The usual workaround is screenshots. Crop the chart, paste it into an email, hope nobody asks a follow-up question. It works right up until someone wants to compare your numbers to anything, at which point a photo of a graph is worth exactly nothing.
This guide covers why CSV is the right format, the four report types worth exporting, and a quick walkthrough of doing it in BuzzyPod.
Key takeaway
CSVs can be sorted, charted, and merged; screenshots can only be admired
Four exports cover almost every need: rankings, episode timelines, daily audience, year-in-review
Sponsors and clients trust raw data more than cropped dashboard images
Match the report to the question — per-episode questions need timelines, trend questions need daily history
A good export opens cleanly in Excel, Google Sheets, or Numbers with zero cleanup
Why CSV beats screenshots
A CSV is a working document. The person receiving it can sort by column, build their own chart, join it with their sales data, and answer their next three questions without emailing you back.
Sponsors can drop your numbers into their own campaign spreadsheets
Clients can verify claims instead of taking your crop job on faith
You can do real planning: pivot tables, moving averages, season-over-season comparisons
It archives cleanly — a folder of CSVs is a history; a folder of screenshots is a scrapbook
The four report types and what each is for
Most analytics questions map to one of four exports. Knowing which to reach for saves you from downloading everything and drowning in tabs.
Episode performance rankings
Every episode ranked by downloads. Use it for media kits, deciding which formats to double down on, and giving sponsored episodes context inside your catalog.
Day-by-day episode timelines
One episode’s downloads, day by day, from release onward. This is the sponsor-report workhorse: it shows delivery across an ad flight and how long an episode keeps earning.
Daily audience history
Total show downloads per day across all episodes. Use it for trend lines, spotting seasonality, and answering “is the show actually growing?” with a chart instead of a feeling.
Year-in-review recap
A whole year summarized in one file. Use it for annual planning, investor or client updates, and the January episode where you tell listeners how the year went.
Exporting from BuzzyPod: the walkthrough
BuzzyPod keeps this deliberately boring, which is the highest compliment you can pay an export feature.
Open your BuzzyPod dashboard and head to exports
Pick the report type: rankings, episode timeline, daily audience, or year-in-review
Preview the data so you know exactly what’s in the file
Click download — the CSV lands immediately, no export queue, no “we’ll email it to you”
The files are clean CSVs that open directly in Excel, Google Sheets, or Numbers. No mystery encodings, no header rows of marketing fluff to delete before row one.
What makes the numbers worth exporting
An export is only as good as the counting behind it. BuzzyPod’s analytics run on OP3, an open, prefix-based measurement service that counts downloads consistently across all listening apps.
That consistency matters when your CSV lands in a media buyer’s spreadsheet next to numbers from other shows. Data from an open, inspectable source travels better than data from a black box.
Three habits that make exports useful
Export daily audience history monthly and keep a running archive folder
Pull an episode timeline the day an ad flight ends, while the renewal conversation is warm
Send sponsors the CSV plus a three-sentence summary — narrative up top, data attached
Conclusion
Exporting analytics to CSV turns your podcast data from something you look at into something you can use — for sponsors, for clients, and for your own planning.
If your current host makes exporting feel like filing a records request, BuzzyPod offers one-click CSVs for rankings, timelines, daily audience, and a year-in-review recap, with a 14-day free trial to test it on your own show.

