The best podcast analytics tools compared

Nathaniel DeSantis
Podcast Analytics

Introduction
Search for the best podcast analytics tools and you’ll find a dozen listicles written by companies ranking themselves first. Let’s try something different: an honest rundown of what each option actually measures, where it shines, and where it stops short.
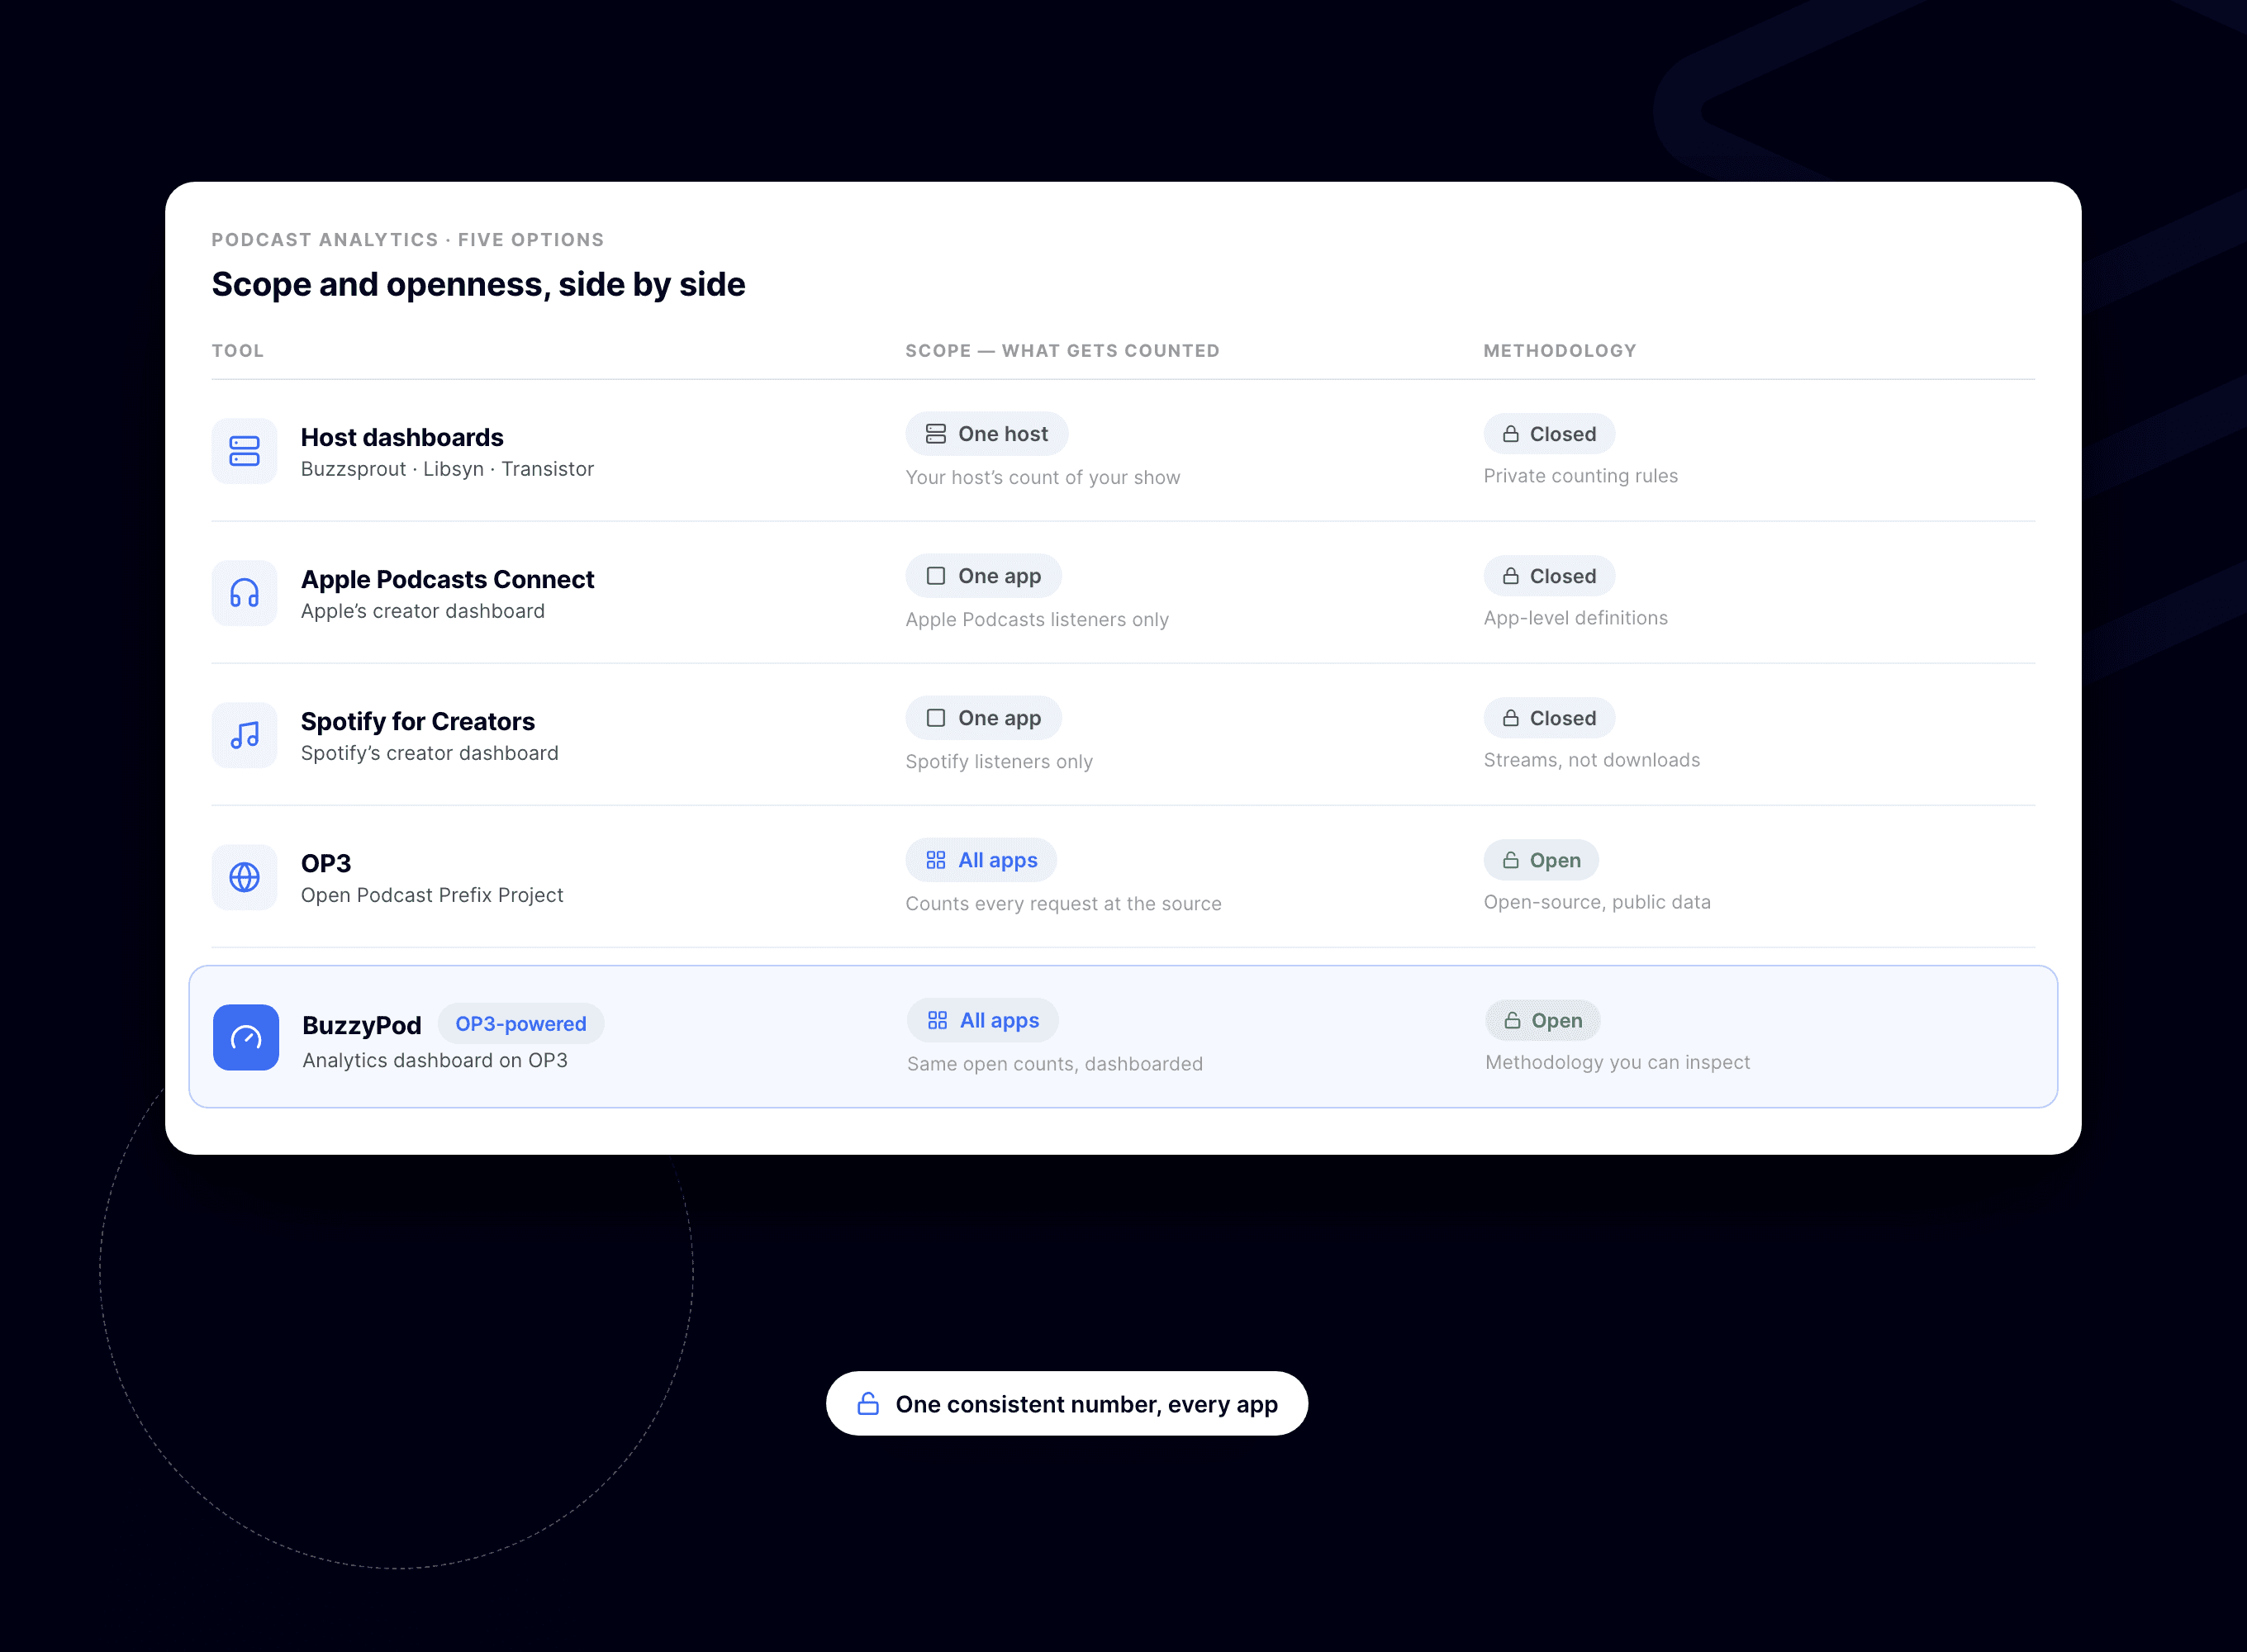
The core issue with every tool is scope. Some see one app, some see one host’s server logs, and only prefix-based measurement sees every app the same way. Once you know that, choosing gets easy.
Here’s the field, compared fairly — including where our own tool fits and what it doesn’t do.
Key takeaway
Host dashboards are convenient but single-source, with proprietary counting
Apple and Spotify dashboards are free and useful, but siloed to their own apps
OP3 offers open, cross-app measurement anyone can audit — but it’s raw
Chartable’s 2024 shutdown is the case for tools you can walk away from with your data
BuzzyPod is the OP3-powered option with maps, curves, exports, and team seats on top
Host dashboards: Buzzsprout, Libsyn, Transistor
Every serious host includes analytics, and the good ones — Buzzsprout, Libsyn, Transistor — do it well. Zero setup, IAB-filtered downloads, and clean charts right where you publish.
Pros: no setup at all, included in your hosting fee, generally IAB-certified counting, decent geography and app data
Cons: single-source — one company’s interpretation of one set of server logs, methodology is proprietary, and your history is tied to staying with that host
Best for: podcasters who want zero extra tooling and don’t need to prove numbers to outside parties
The quiet catch: switch hosts and your numbers “change” overnight, because the counting rules changed with the logo. Nothing happened to your audience.
Apple Podcasts Connect and Spotify for Creators
Both are free, both are worth checking, and both measure only their own walled garden. Apple reports followers and plays from the Apple Podcasts app; Spotify reports streams and consumption inside Spotify.
Pros: free, and they offer engagement data downloads can’t — where listeners stop, follower trends, consumption time
Cons: each covers one app only, metrics aren’t comparable across platforms or with downloads, and neither describes your whole audience
Best for: engagement and retention insight on each platform, as a supplement — never as your primary count
OP3: the open measurement layer
OP3 (op3.dev), the Open Podcast Prefix Project, was created by John Spurlock and launched in 2022. It’s open-source and privacy-preserving: a short op3.dev/e/ prefix on your episode URLs counts each request before redirecting to your audio, so every app is measured the same open way — and the data is published openly.
Pros: cross-app, auditable methodology, portable across hosts, free and open-source, credible with sponsors precisely because anyone can verify it
Cons: it’s a measurement service, not a polished analytics product — expect raw data rather than a comfy dashboard
Best for: anyone who wants one trustworthy number and doesn’t mind spartan presentation
Chartable: a cautionary tale
Chartable deserves a mention as a warning label. It was a popular independent analytics and attribution service — until Spotify acquired it and shut it down in 2024, leaving podcasters scrambling to replace links and export history.
The lesson isn’t “never trust tools.” It’s: prefer open data and easy exports, so no acquisition can strand your numbers. Measurement history is one of the few assets a podcast accumulates — keep it portable.
BuzzyPod: the OP3-powered dashboard
Full disclosure: this is us, so judge accordingly. BuzzyPod is built on OP3’s open measurement and adds the dashboard layer OP3 deliberately doesn’t: total downloads with 7-day and 30-day change, daily charts, an interactive world map by country and US metro, device and app breakdowns, per-episode curves, and episode comparison aligned day-by-day from launch.
Pros: cross-app OP3 data with a friendly interface, first-30-day launch-curve comparisons, one-click CSV exports, guest release forms with e-signing, unlimited team seats, $10/month flat with a 14-day trial
Cons: no age/gender demographics (nobody has real per-show ones), geography is countries plus US metros, and it’s not a host — you keep your existing hosting
Best for: podcasters who want OP3’s honest numbers without living in raw data
How to choose
Just starting out: your host’s dashboard is genuinely enough — revisit when numbers start mattering
Talking to sponsors: you need a cross-app, verifiable count — that means prefix-based measurement
Data-tinkerer: use OP3 directly and enjoy the raw openness
Want the open data plus maps, curves, and exports your team can share: that’s the gap BuzzyPod exists to fill
Conclusion
There’s no single best podcast analytics tool — there’s the right scope for your stage. Host dashboards for convenience, platform dashboards for engagement, and open prefix-based measurement the moment your numbers need to be believed by someone else.
If that moment has arrived, BuzzyPod’s 14-day free trial is a low-stakes way to see your whole audience in one honest, OP3-powered dashboard.
Related reading
Introduction
Search for the best podcast analytics tools and you’ll find a dozen listicles written by companies ranking themselves first. Let’s try something different: an honest rundown of what each option actually measures, where it shines, and where it stops short.
The core issue with every tool is scope. Some see one app, some see one host’s server logs, and only prefix-based measurement sees every app the same way. Once you know that, choosing gets easy.
Here’s the field, compared fairly — including where our own tool fits and what it doesn’t do.
Key takeaway
Host dashboards are convenient but single-source, with proprietary counting
Apple and Spotify dashboards are free and useful, but siloed to their own apps
OP3 offers open, cross-app measurement anyone can audit — but it’s raw
Chartable’s 2024 shutdown is the case for tools you can walk away from with your data
BuzzyPod is the OP3-powered option with maps, curves, exports, and team seats on top
Host dashboards: Buzzsprout, Libsyn, Transistor
Every serious host includes analytics, and the good ones — Buzzsprout, Libsyn, Transistor — do it well. Zero setup, IAB-filtered downloads, and clean charts right where you publish.
Pros: no setup at all, included in your hosting fee, generally IAB-certified counting, decent geography and app data
Cons: single-source — one company’s interpretation of one set of server logs, methodology is proprietary, and your history is tied to staying with that host
Best for: podcasters who want zero extra tooling and don’t need to prove numbers to outside parties
The quiet catch: switch hosts and your numbers “change” overnight, because the counting rules changed with the logo. Nothing happened to your audience.
Apple Podcasts Connect and Spotify for Creators
Both are free, both are worth checking, and both measure only their own walled garden. Apple reports followers and plays from the Apple Podcasts app; Spotify reports streams and consumption inside Spotify.
Pros: free, and they offer engagement data downloads can’t — where listeners stop, follower trends, consumption time
Cons: each covers one app only, metrics aren’t comparable across platforms or with downloads, and neither describes your whole audience
Best for: engagement and retention insight on each platform, as a supplement — never as your primary count
OP3: the open measurement layer
OP3 (op3.dev), the Open Podcast Prefix Project, was created by John Spurlock and launched in 2022. It’s open-source and privacy-preserving: a short op3.dev/e/ prefix on your episode URLs counts each request before redirecting to your audio, so every app is measured the same open way — and the data is published openly.
Pros: cross-app, auditable methodology, portable across hosts, free and open-source, credible with sponsors precisely because anyone can verify it
Cons: it’s a measurement service, not a polished analytics product — expect raw data rather than a comfy dashboard
Best for: anyone who wants one trustworthy number and doesn’t mind spartan presentation
Chartable: a cautionary tale
Chartable deserves a mention as a warning label. It was a popular independent analytics and attribution service — until Spotify acquired it and shut it down in 2024, leaving podcasters scrambling to replace links and export history.
The lesson isn’t “never trust tools.” It’s: prefer open data and easy exports, so no acquisition can strand your numbers. Measurement history is one of the few assets a podcast accumulates — keep it portable.
BuzzyPod: the OP3-powered dashboard
Full disclosure: this is us, so judge accordingly. BuzzyPod is built on OP3’s open measurement and adds the dashboard layer OP3 deliberately doesn’t: total downloads with 7-day and 30-day change, daily charts, an interactive world map by country and US metro, device and app breakdowns, per-episode curves, and episode comparison aligned day-by-day from launch.
Pros: cross-app OP3 data with a friendly interface, first-30-day launch-curve comparisons, one-click CSV exports, guest release forms with e-signing, unlimited team seats, $10/month flat with a 14-day trial
Cons: no age/gender demographics (nobody has real per-show ones), geography is countries plus US metros, and it’s not a host — you keep your existing hosting
Best for: podcasters who want OP3’s honest numbers without living in raw data
How to choose
Just starting out: your host’s dashboard is genuinely enough — revisit when numbers start mattering
Talking to sponsors: you need a cross-app, verifiable count — that means prefix-based measurement
Data-tinkerer: use OP3 directly and enjoy the raw openness
Want the open data plus maps, curves, and exports your team can share: that’s the gap BuzzyPod exists to fill
Conclusion
There’s no single best podcast analytics tool — there’s the right scope for your stage. Host dashboards for convenience, platform dashboards for engagement, and open prefix-based measurement the moment your numbers need to be believed by someone else.
If that moment has arrived, BuzzyPod’s 14-day free trial is a low-stakes way to see your whole audience in one honest, OP3-powered dashboard.
Related reading
Introduction
Search for the best podcast analytics tools and you’ll find a dozen listicles written by companies ranking themselves first. Let’s try something different: an honest rundown of what each option actually measures, where it shines, and where it stops short.
The core issue with every tool is scope. Some see one app, some see one host’s server logs, and only prefix-based measurement sees every app the same way. Once you know that, choosing gets easy.
Here’s the field, compared fairly — including where our own tool fits and what it doesn’t do.
Key takeaway
Host dashboards are convenient but single-source, with proprietary counting
Apple and Spotify dashboards are free and useful, but siloed to their own apps
OP3 offers open, cross-app measurement anyone can audit — but it’s raw
Chartable’s 2024 shutdown is the case for tools you can walk away from with your data
BuzzyPod is the OP3-powered option with maps, curves, exports, and team seats on top
Host dashboards: Buzzsprout, Libsyn, Transistor
Every serious host includes analytics, and the good ones — Buzzsprout, Libsyn, Transistor — do it well. Zero setup, IAB-filtered downloads, and clean charts right where you publish.
Pros: no setup at all, included in your hosting fee, generally IAB-certified counting, decent geography and app data
Cons: single-source — one company’s interpretation of one set of server logs, methodology is proprietary, and your history is tied to staying with that host
Best for: podcasters who want zero extra tooling and don’t need to prove numbers to outside parties
The quiet catch: switch hosts and your numbers “change” overnight, because the counting rules changed with the logo. Nothing happened to your audience.
Apple Podcasts Connect and Spotify for Creators
Both are free, both are worth checking, and both measure only their own walled garden. Apple reports followers and plays from the Apple Podcasts app; Spotify reports streams and consumption inside Spotify.
Pros: free, and they offer engagement data downloads can’t — where listeners stop, follower trends, consumption time
Cons: each covers one app only, metrics aren’t comparable across platforms or with downloads, and neither describes your whole audience
Best for: engagement and retention insight on each platform, as a supplement — never as your primary count
OP3: the open measurement layer
OP3 (op3.dev), the Open Podcast Prefix Project, was created by John Spurlock and launched in 2022. It’s open-source and privacy-preserving: a short op3.dev/e/ prefix on your episode URLs counts each request before redirecting to your audio, so every app is measured the same open way — and the data is published openly.
Pros: cross-app, auditable methodology, portable across hosts, free and open-source, credible with sponsors precisely because anyone can verify it
Cons: it’s a measurement service, not a polished analytics product — expect raw data rather than a comfy dashboard
Best for: anyone who wants one trustworthy number and doesn’t mind spartan presentation
Chartable: a cautionary tale
Chartable deserves a mention as a warning label. It was a popular independent analytics and attribution service — until Spotify acquired it and shut it down in 2024, leaving podcasters scrambling to replace links and export history.
The lesson isn’t “never trust tools.” It’s: prefer open data and easy exports, so no acquisition can strand your numbers. Measurement history is one of the few assets a podcast accumulates — keep it portable.
BuzzyPod: the OP3-powered dashboard
Full disclosure: this is us, so judge accordingly. BuzzyPod is built on OP3’s open measurement and adds the dashboard layer OP3 deliberately doesn’t: total downloads with 7-day and 30-day change, daily charts, an interactive world map by country and US metro, device and app breakdowns, per-episode curves, and episode comparison aligned day-by-day from launch.
Pros: cross-app OP3 data with a friendly interface, first-30-day launch-curve comparisons, one-click CSV exports, guest release forms with e-signing, unlimited team seats, $10/month flat with a 14-day trial
Cons: no age/gender demographics (nobody has real per-show ones), geography is countries plus US metros, and it’s not a host — you keep your existing hosting
Best for: podcasters who want OP3’s honest numbers without living in raw data
How to choose
Just starting out: your host’s dashboard is genuinely enough — revisit when numbers start mattering
Talking to sponsors: you need a cross-app, verifiable count — that means prefix-based measurement
Data-tinkerer: use OP3 directly and enjoy the raw openness
Want the open data plus maps, curves, and exports your team can share: that’s the gap BuzzyPod exists to fill
Conclusion
There’s no single best podcast analytics tool — there’s the right scope for your stage. Host dashboards for convenience, platform dashboards for engagement, and open prefix-based measurement the moment your numbers need to be believed by someone else.
If that moment has arrived, BuzzyPod’s 14-day free trial is a low-stakes way to see your whole audience in one honest, OP3-powered dashboard.

